"Increasingly, Brooklyn is starting to look a lot more like [Mayoral candidate Bill] de Blasio and the idyllic, thoroughly gentrified Park Slope neighborhood he calls home: whiter, better educated and higher earning."My guess, especially after reading the rest of the article, is de Blasio knows better than to use this line campaigning around Brooklyn. Really, anyone who's taken a long walk in Brooklyn should know better. But we'll take a look at each of these claims.
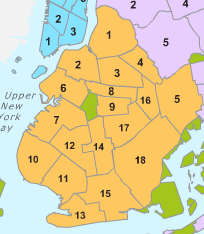
Here's a map of Brooklyn's Community Districts:
The Census Bureau (as compiled by researchers at CUNY or as linked to by the city) has various demographic statistics and estimates by Community District (or approximations--"PUMAs"--thereof) for both 2000 and more recently.
Park Slope is in Brooklyn's Community District 6, along with a few similar neighborhoods like Carroll Gardens.
Let's start with the claim that Brooklyn has gotten whiter.
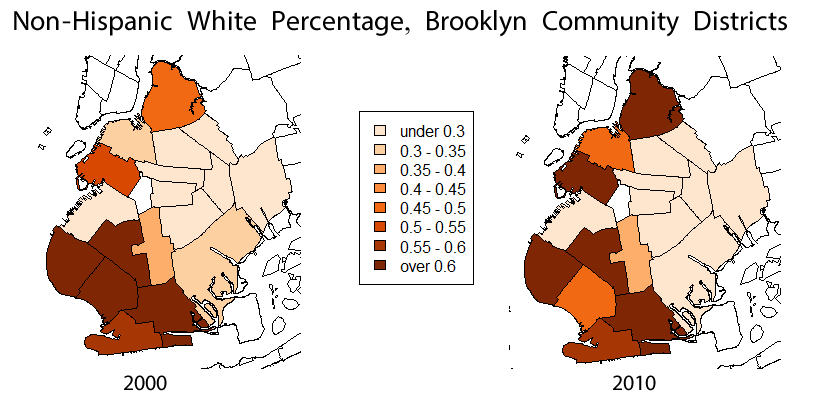
But in 2000, District 6 was 54.9% non-Hispanic white--much whiter than Brooklyn. By 2010, it was 62.7% non-Hispanic white: much, much whiter than Brooklyn. So Brooklyn (in the aggregate) looks quite a bit less like Park Slope than it did in 2000.
This is even more true of District 1, which contains Williamsburg, the subject of seemingly every third New York Times article. From 2000 to 2010, District 1 went from 48.0% non-Hispanic white (much whiter than Brooklyn) to 60.8% non-Hispanic white (again, much, much whiter than Brooklyn).
But how is it possible that Brooklyn barely got whiter, while Williamsburg and Park Slope got much whiter?
While it might come as a surprise to some readers of the New York Times, there are in fact other parts of Brooklyn than Williamsburg and Park Slope, and many of them had decreasing white populations, increasing nonwhite populations, or both. But for our current purposes, let's just look at the changes in non-Hispanic White percentage.

Yes, the non-Hispanic white population increased in those Manhattan-adjacent Community Districts. But the non-Hispanic white percentage in the borough barely changed, because there's more going on.
Community District 11 (Bensonhurst and Bath Beach) became narrowly majority-minority as the Asian and Hispanic populations soared. The African-American population in Community District 18 (Canarsie) increased by over 16,000. The minority population share in Community District 5 (East New York) went from 94.9% to 96.6%.
These places seem to get far, far less press attention than Williamsburg and Park Slope. But, as of 2010, they have well over half a million people between them. The combined population of Districts 5, 11, and 18 is 22.3% of the population of Brooklyn and about the equal to the population of Albuquerque, New Mexico.
Has Brooklyn gotten higher earning?
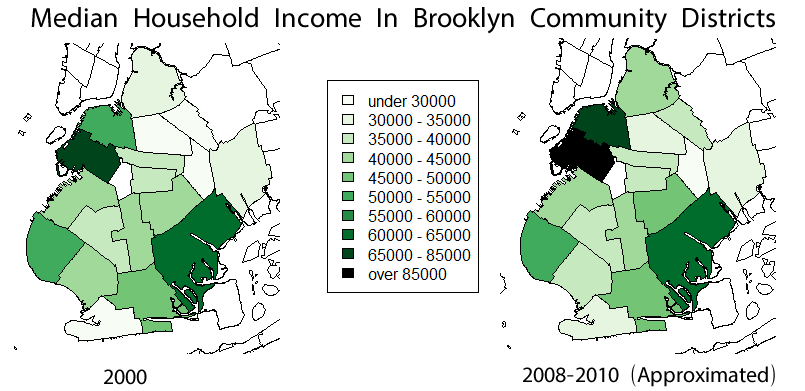
Kind of. In 2011, the Census estimated the median household in Brooklyn earned $42,752 a year. In 1999 the Census estimated the median household income in Brooklyn was...$42,852 (in 2011 dollars; the listed figure in 1999 dollars is $32,135). That's compared to a national median household income of $50,502 (in 2011) and $55,999 (in 1999), again using 2011 dollars. In constant dollars, Brooklyn stagnated while incomes dropped elsewhere.
What about Park Slope? The median household income in District 6 went from $66,736 in 2000 to $85,985 in a 2008-2010 two-year estimate (in constant dollars or something close).
 This was, as you can see, a far greater increase than anywhere else in the borough--and District 6 already had the highest median household income in Brooklyn. Many of Brooklyn's Community Districts saw minimal change or even decreasing median household income.
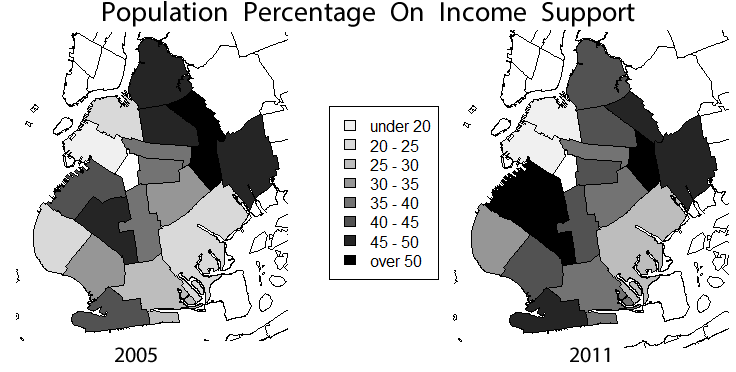
We can also look at income support. The Community District profiles include the percentage of the population on some form of income support: TANF, SSI, or Medicaid.

These six districts comprise more or less the area people talk about when they talk about gentrification and so on. It's basically the same group that had significantly rising median household income and the same group that got significantly whiter.
But these six districts collectively account for less than 30% of Brooklyn's 2010 population. More than 70% of Brooklyn lives in a community district where the percentage of people on income support actually increased from 2005-2011. Maybe that's not surprising, given the recession. But it's important.
Has Brooklyn gotten better educated?

This probably has the most to it. In 2000, 21.8% of Brooklyn's 25-and-over population had a bachelor's degree or higher, compared to 24.4% nationally. By 2011, that was up to 29.9%, compared to 28.5% nationally. Brooklyn's gone from being a bit less well-educated than the country to a bit more well-educated.
But Park Slope? Park Slope's District 6 went from 52.5% with a bachelor's degree to 65.3%! (Again, that's from a 2008-2010 two-year estimate.)
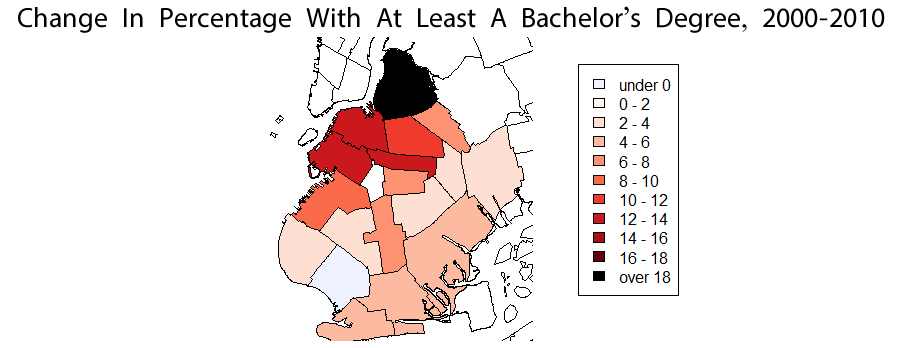
Williamsburg's District 1's percentage doubled, from 18.4% to 36.8%. Park Slope's district went from much more educated than Brooklyn to much, much more educated, and Williamsburg's district went from a little less educated than Brooklyn to much more educated than Brooklyn. But in this case, at least, the increase is more well-distributed than in some of the other cases.

I'll end with something positive. The original quote had two parts. The second was that Brooklyn, itself, is getting whiter, better educated, and higher earning. That's...not completely wrong, based on the information I have. Brooklyn is (a very small amount) whiter, (more significantly) better educated, and (arguably not even) higher earning.
Has Brooklyn gotten higher earning?
Kind of. In 2011, the Census estimated the median household in Brooklyn earned $42,752 a year. In 1999 the Census estimated the median household income in Brooklyn was...$42,852 (in 2011 dollars; the listed figure in 1999 dollars is $32,135). That's compared to a national median household income of $50,502 (in 2011) and $55,999 (in 1999), again using 2011 dollars. In constant dollars, Brooklyn stagnated while incomes dropped elsewhere.
What about Park Slope? The median household income in District 6 went from $66,736 in 2000 to $85,985 in a 2008-2010 two-year estimate (in constant dollars or something close).

We can also look at income support. The Community District profiles include the percentage of the population on some form of income support: TANF, SSI, or Medicaid.
From 2005-2011, the percentage of Brooklyn's population on income support actually increased, from 36.9% to 40.9%.
Just like Park Slope! No. In Park Slope's District 6, the percentage declined, from 18.9% to just 16%. Once again: Park Slope's district, already atypical, got even more unlike Brooklyn. (The percentage also declined in District 1, from 47.1% to 41.9%, although I suppose that's getting closer to Brooklyn's percentage. Part of the reason Williamsburg has such large percentage increases is that it's starting from a low base in several ways.)
Just like Park Slope! No. In Park Slope's District 6, the percentage declined, from 18.9% to just 16%. Once again: Park Slope's district, already atypical, got even more unlike Brooklyn. (The percentage also declined in District 1, from 47.1% to 41.9%, although I suppose that's getting closer to Brooklyn's percentage. Part of the reason Williamsburg has such large percentage increases is that it's starting from a low base in several ways.)
The percentage of the population on income support declined in just six Community Districts out of eighteen: Districts 1, 2, 3, 4, 6, and 8.
These six districts comprise more or less the area people talk about when they talk about gentrification and so on. It's basically the same group that had significantly rising median household income and the same group that got significantly whiter.
But these six districts collectively account for less than 30% of Brooklyn's 2010 population. More than 70% of Brooklyn lives in a community district where the percentage of people on income support actually increased from 2005-2011. Maybe that's not surprising, given the recession. But it's important.
Has Brooklyn gotten better educated?
This probably has the most to it. In 2000, 21.8% of Brooklyn's 25-and-over population had a bachelor's degree or higher, compared to 24.4% nationally. By 2011, that was up to 29.9%, compared to 28.5% nationally. Brooklyn's gone from being a bit less well-educated than the country to a bit more well-educated.
But Park Slope? Park Slope's District 6 went from 52.5% with a bachelor's degree to 65.3%! (Again, that's from a 2008-2010 two-year estimate.)
Williamsburg's District 1's percentage doubled, from 18.4% to 36.8%. Park Slope's district went from much more educated than Brooklyn to much, much more educated, and Williamsburg's district went from a little less educated than Brooklyn to much more educated than Brooklyn. But in this case, at least, the increase is more well-distributed than in some of the other cases.
We could also look at real estate prices (mostly because I want to have something from a non-Census source). This is from PropertyShark, via CityLimits, and it shows the increase in residential price per square foot from 2004-2012.
Williamsburg's prices increased 174% in 8 years. This is, to say the least, not representative of Brooklyn. It's nearly three times as large as the percentage increase in any other area. Community Districts 2 and 6 seem to cover many of the other areas that had large increases. And large swaths of the borough saw either decrease or stagnation.
But that still makes it pretty hard to believe the first part of the claim. The part about how Brooklyn is "increasingly...starting to look a lot more" like Park Slope. Stagnating borough-wide median income and a 1% increase in non-Hispanic white population isn't enough to turn Brooklyn into Park Slope Large. (The 8.1% increase in bachelor's degrees might help...if Park Slope hadn't had a 12.1% increase.)
You know the old joke about how when Bill Gates walks into a bar everyone in it is suddenly, on average, a millionaire?
Park Slope (to use shorthand for the surrounding area) is, itself, getting whiter, better educated, and higher earning. That's driving some of Brooklyn's aggregate change. ("In the aggregate, everyone in this bar is now a millionaire!")
But it means Park Slope is getting farther away from Brooklyn, not closer, because it was already the best-educated and highest-earning part of Brooklyn, and among the whitest. And (most of) the rest of the borough isn't keeping up with Park Slope's rate of change.
(I recall looking at this article which argued that, similarly, a few Community Districts in lower Manhattan "pulled away" from everywhere else.)
I'll conclude with another map from CityLimits, this (lovely) one showing the poverty rate.


